
Graphing is fun! That's what I wanted my students to say after we completed our graphing project. And I think it was a success!
So it was graphing time in 2nd grade and I wanted to try and use our iPads for this topic. I started by having my students come up with three different questions with up to five choices. They had great questions from favorite type of hen, favorite Minecraft character, favorite school lunch, favorite board game to many others.
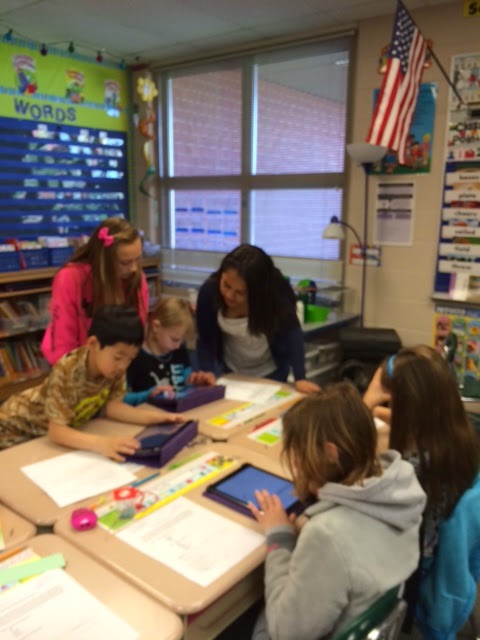
The next step involved our wonderful 6th Grade buddies. They came in and helped my students type up their questions using Google Forms in Safari. I am very thankful for the extra hands too. Google Forms tended to be very sensitive on the iPad.


After creating their form, my students shared it with me via Google Drive. I then did some networking and sent out their forms to other classrooms in my school district. I chose other teachers with 1:1 iPad classes. That way my students could get several responses from other kids. My teacher friends didn't let me down. Some of my students received over 60 responses to their questions.
Now came the daunting task of counting the responses and organizing the data. My students were able to view their data in Google Drive. That is a nice feature of using Google! It all works together!! My students recorded their data using tally marks and a table. It was an unplugged way to record the data, but it got the job done.


The final step was to turn the data into graphs. My students made bar graphs and a pictographs. They used pre-made tables to organize their data. This was not a high-tech way to make a graph, but I wanted my students to make a paper graph before using technology to make a graph. My goal was for them to understand the complete process of how to make a graph from beginning to end.


 Now that my students completed their graphs on paper, I really wanted them to use technology to make a graph. Problem was finding an App that was easy for young students to use. I went to the App store and started looking. There are some free Apps, but they didn't look kid friendly or the reviews were a little negative. I found a $2.99 App called "Graphing For Kids." The App walks students through a "How To" and then "Chart Maker" sections. Students have to title their graph, label the graph, input the choices and the numbers. Then they click on the word "graphing" and there are four options for graphs. They can make a pie chart, horizontal and vertical bar graphs, and a line graph. Students can save their data to view any time. There is not a way to export the graphs but we just took screen shots and uploaded the pictures to Google Drive to share as needed. Here are some samples of student work.


Overall the graphing project was a success! My students learned how to question, collect data, organize their data, make a graph and use a new App. I might even say that they had some fun too!
No comments:
Post a Comment